Market Outlook
August 26, 2016
Market Cues
Domestic Indices
Chg (%)
(Pts)
(Close)
Indian markets are likely to open on a flat note tracking SGX Nifty.
BSE Sensex
(0.8)
(224)
27,836
Nifty
(0.7)
(58)
8,592
US markets moved slightly lower on Thursday as investors were unwilling to take big
positions ahead of the speech by Fed Chair Janet Yellen. The US Commerce a
Mid Cap
(0.4)
(46)
12,978
report showing stronger than expected durable goods orders. Retail and
Small Cap
(0.1)
(13)
12,502
transportation stocks gave a weak performance while gold stocks recovered some of
Bankex
(0.3)
(72)
22,136
their previous losses.
UK markets lost ground on Thursday after losses from commodity producers and
Global Indices
Chg (%)
(Pts)
(Close)
pharma stocks pulled down the indices. Weakness in pharma stocks resulted due to
Dow Jones
(0.2)
(33)
18,448
US Presidential candidate Hillary Clinton vowing to pressure drug firms to lower
Nasdaq
(0.1)
(5)
5,212
prices. Weak commodity prices continued to hamper the performance of material
FTSE
(0.3)
(19)
6,817
stocks.
Nikkei
(0.2)
(41)
16,556
Indian markets slipped lower on weak global cues and due to the derivatives expiry.
Hang Seng
(0.0)
(6)
22,815
Investors turned cautious and reduced exposure ahead of the Fed announcement
Shanghai Com
(0.6)
(18)
3,068
expected on Friday. FMCG was the gainer for the session with most other sectors
losing out.
Advances / Declines
BSE
NSE
News Analysis
Advances
1,219
640
Monsanto drops as company cancels plan to introduce GM cotton seeds
Declines
1,496
942
Titan Company to boost watch business with smartwatches
Unchanged
184
75
Detailed analysis on Pg2
Investor’s Ready Reckoner
Volumes (` Cr)
Key Domestic & Global Indicators
BSE
2,923
Stock Watch: Latest investment recommendations on 150+ stocks
NSE
25,163
Refer Pg5 onwards
Net Inflows (` Cr)
Net
Mtd
Ytd
Top Picks
CMP
Target
Upside
Company
Sector
Rating
FII
(33)
7,918
38,801
(`)
(`)
(%)
MFs
(51)
299
9,087
Amara Raja
Auto/Auto Ancillary
Buy
883
1,076
21.9
HCL Tech
IT
Buy
799
1,000
25.2
HDFC Bank
Financials
Accumulate
1,258
1,350
7.3
Top Gainers
Price (`)
Chg (%)
Bharat Electronics
Capital Goods
Buy
1,206
1,414
17.3
Gvkpil
7
8.1
Equitas Holdings
Financials
Buy
181
235
29.7
Jubilant
531
4.6
Navkar Corporation Others
Buy
197
265
34.8
Natcopharm
684
4.3
More Top Picks on Pg4
Hcc
23
4.0
Justdial
486
3.9
Key Upcoming Events
Previous
Consensus
Date
Region
Event Description
Reading
Expectations
Top Losers
Price (`)
Chg (%)
Aug 26 US
Initial Jobless claims
262.00
265.00
Torntpharm
1,612
(5.3)
Aug 26 UK
GDP (YoY)
2.20
2.20
Manappuram
81
(4.7)
Aug 30 Germany
Unemployment change (000's)
(7.00)
Pcjeweller
418
(4.0)
Aug 30 Euro Zone
Euro-Zone Consumer Confidence
(8.50)
Aug 31 US
Consumer Confidence
97.30
96.65
Kpit
130
(3.7)
6.(
More Events on Pg5
Shriramcit
2,095
(3.5)
As on August 25, 2016
Market Outlook
August 26, 2016
News Analysis
Monsanto drops as company cancels plan to introduce GM cotton
seeds
Shares of Monsanto India fell nearly three per cent after the company announced
that it had withdrawn an application seeking approval for the next generation of
genetically modified (GM) cotton seeds in India because of regulatory
uncertainties. The scrip went down 2.78 per cent to end at `2,368.90 on the BSE
and at `2,374.60 on the NSE.
The application seeking environment clearance for commercial cultivation of
'Bollgard-II Roundup Ready Flex technology' was withdrawn on July
6.
The company’s stated that its decision to suspend the introduction of the product in
India was an outcome of the uncertainty in the business and regulatory
environment. This uncertainty also included the regulation of trait fees and
introduction of the draft compulsory licensing guidelines.
This decision would have no impact on Monsanto’s current cotton portfolio being
sold in India.
Titan Company to boost watch business with smartwatches
Titan Company is pinning hopes on smart watches to boost its watch business. This
division has shown some softness in the past quarter.
In the last quarter, the overall revenue from the watch business for Titan grew by
14%, though the profits (before interests and tax) grew only by 4%. Operating
margin of the business declined by 14%.
Titan which is the country's leading watchmaker and the fifth in the world,
launched the first smartwatch JUXT in January this year and has already sold
10,000 pieces. The company has now launched JUXPro, the next variant with
more features at a cost of Rs 22,995, targeting youth and technology freaks.
While the contribution of the smartwatches to its overall revenue is very low, the
company hopes the launch will attract more excitement to the brand and the
results will be shown in the next quarter.
Economic and Political News
IRDAI has asked insurance companies to file periodical report on compliance
to investment guidelines from quarter ending March 2017
RBI ruling to make corporate borrowing more expensive from FY18
Unified Payment interface goes live in four banks
Corporate News
US patent office rules in favour of Natco Pharma marketing partner Mylan
Govt. panel to decide requirement of coal by Reliance Power's arm Sasan
Power
Patanjali becomes third largest FMCG seller in Future Retail
Market Outlook
August 26, 2016
Quarterly Bloomberg Brokers Consensus Estimate
Tata Motors Ltd Consol - Aug 26, 2016
Particulars (` cr)
1QFY17E
1QFY16
y-o-y (%)
4QFY16
q-o-q (%)
Net sales
63,783
60,181
6.0
79,926
(20.2)
EBITDA
8,656
9,109
(5.0)
11,387
(24.0)
EBITDA margin (%)
13.6
15.1
14.2
Net profit
2,416
2,769
(12.8)
4,573
(47.2)
DLF Ltd Consol - Aug 29, 2016
Particulars (` cr)
1QFY17E
1QFY16
y-o-y (%)
4QFY16
q-o-q (%)
Net sales
2,219
2,231
(0.6)
2,336
(5.0)
EBITDA
840
827
1.5
874
(3.9)
EBITDA margin (%)
37.9
37.1
37.4
Net profit
134
122
10.2
132
1.2
Indian Oil Corp Ltd - Aug 29, 2016
Particulars (` cr)
1QFY17E
1QFY16
y-o-y (%)
4QFY16
q-o-q (%)
Net sales
94,037
1,01,009
(6.9)
80,019
17.5
EBITDA
8,960
10,101
(11.3)
4,044
121.5
EBITDA margin (%)
9.5
10.0
5.1
Net profit
4,214
6,436
(34.5)
1,243
239.0
Bharat Petroleum Corp Ltd - Sept 1 , 2016
Particulars (` cr)
1QFY17E
1QFY16
y-o-y (%)
4QFY16
q-o-q (%)
Net sales
49,977
51,917
(3.7)
44,146
13.2
EBITDA
3,485
3,818
(8.7)
3,490
(0.1)
EBITDA margin (%)
7.0
7.4
7.9
Net profit
2,172
2,376
(8.6)
2,549
(14.8)
Market Outlook
August 26, 2016
Top Picks ★★★★★
Large Cap
Market Cap
CMP
Target
Upside
Company
Rationale
(` Cr)
(`)
(`)
(%)
To outpace battery industry growth due to better technological
Amara Raja Batteries
15,078
883
1,076
21.9
products leading to market share gains in both the automotive
OEM and replacement segments.
Uptick in defense capex by government, coupled with BELs
Bharat Electronics
28,939
1,206
1,414
17.3
strong market positioning, indicate good times ahead for BEL.
HCL Tech
1,12,677
799
1,000
25.2
Stock is trading at attractive valuations & factors all bad news.
Strong visibility for a robust 20% earnings trajectory, coupled
HDFC Bank
3,18,417
1,258
1,350
7.3
with high quality of earnings on account of high quality retail
business and strategic focus on highly rated corporates.
Back on the growth trend, expect a long term growth of 14% to
Infosys
2,38,090
1,037
1,370
32.2
be a US$20bn in FY2020.
Strong market positioning within the domestic AC markets to
Voltas
12,559
380
407
7.2
continue, EMP business set to revive
Source: Company, Angel Research
Mid Cap
Market Cap
CMP
Target
Upside
Company
Rationale
(` Cr)
(`)
(`)
(%)
Among the top 4 players in the consumer durables segment.
Bajaj Electricals
2,549
252
277
9.8
Improved profitability backed by turn around in E&P segment.
Strong order book lends earnings visibility.
Favourable outlook for the AC industry to augur well for
Cooling products business which is out pacing the market
Blue Star
4,672
490
527
7.6
growth. EMPPAC division's profitability to improve once
operating environment turns around.
Strong loan growth backed by diversified loan portfolio and
Equitas Holdings
6,077
181
235
29.7
adequate CAR. ROE & ROA likely to remain decent as risk of
dilution remains low. Attractive valuations considering growth.
Expectations of above average monsoon augurs well for
Goodyear India
1,260
546
631
15.5
Goodyear India as it derives ~50% of its turnover from farm
tyre segment.
Commencement of new projects, downtrend in the interest rate
IL&FS Transport
2,352
72
93
30.1
cycle, to lead to stock re-rating
Economic recovery to have favourable impact on advertising &
Jagran Prakashan
6,169
189
205
8.6
circulation revenue growth. Further, the acquisition of a radio business
(Radio City) would also boost the company`s revenue growth.
Speedier execution and speedier sales, strong revenue visibility
Mahindra Lifespace
1,773
432
522
20.8
in short-to-long run, attractive valuations
Massive capacity expansion along with rail advantage at ICD as
Navkar Corporation
2,803
197
265
34.8
well CFS augurs well for the company
Earnings boost on back of stable material prices and favourable
Radico Khaitan
1,265
95
125
31.5
pricing environment. Valuation discount to peers provides
additional comfort
Strong brands and distribution network would boost growth
Siyaram Silk Mills
1,157
1,235
1,347
9.1
going ahead. Stock currently trades at an inexpensive valuation.
Market leadership in Hindi news genre and no. 2 viewership
TV Today Network
1,783
299
363
21.4
ranking in English news genre, exit from the radio business, and
anticipated growth in ad spends by corporates to benefit the stock.
Source: Company, Angel Research
Market Outlook
August 26, 2016
Key Upcoming Events
Result Calendar
Date
Company
August 26, 2016 Tata Motors, Abbott India
August 27, 2016 Electrosteel Castings
August 29, 2016 MOIL, Prakash Industries, IOC, DLF
Source: Bloomberg, Angel Research
Global economic events release calendar
Bloomberg Data
Date
Time
Country Event Description
Unit
Period
Last Reported Estimated
Aug 26, 2016
6:00 PM
US
Initial Jobless claims
ThousandsAug 20
262.00
265.00
2:00 PM
UK
GDP (YoY)
% Change 2Q P
2.20
2.20
Aug 30, 2016
1:25 PM Germany Unemployment change (000's)
Thousands Aug
(7.00)
2:30 PM Euro ZoneEuro-Zone Consumer Confidence
Value Aug F
(8.50)
Aug 31, 2016
7:30 PM
US
Consumer Confidence S.A./ 1985=100 Aug
97.30
96.65
Sep 01, 2016
1:25 PM Germany
PMI Manufacturing
Value Aug F
53.60
2:00 PM
UK
PMI Manufacturing
Value Aug
48.20
6:30 AM
China
PMI Manufacturing
Value Aug
49.90
50.00
Sep 02, 2016
6:00 PM
US
Change in Nonfarm payrolls
Thousands Aug
255.00
180.00
6:00 PM
US
Unnemployment rate
% Aug
4.90
4.80
Sep 05, 2016
1:25 PM Germany
PMI Services
Value Aug F
53.30
Sep 06, 2016
2:30 PM Euro Zone
Euro-Zone GDP s.a. (QoQ)
% Change 2Q F
0.30
Sep 07, 2016
2:00 PM
UK
Industrial Production (YoY)
% Change Jul
1.60
Source: Bloomberg, Angel Research
Market Outlook
August 26, 2016
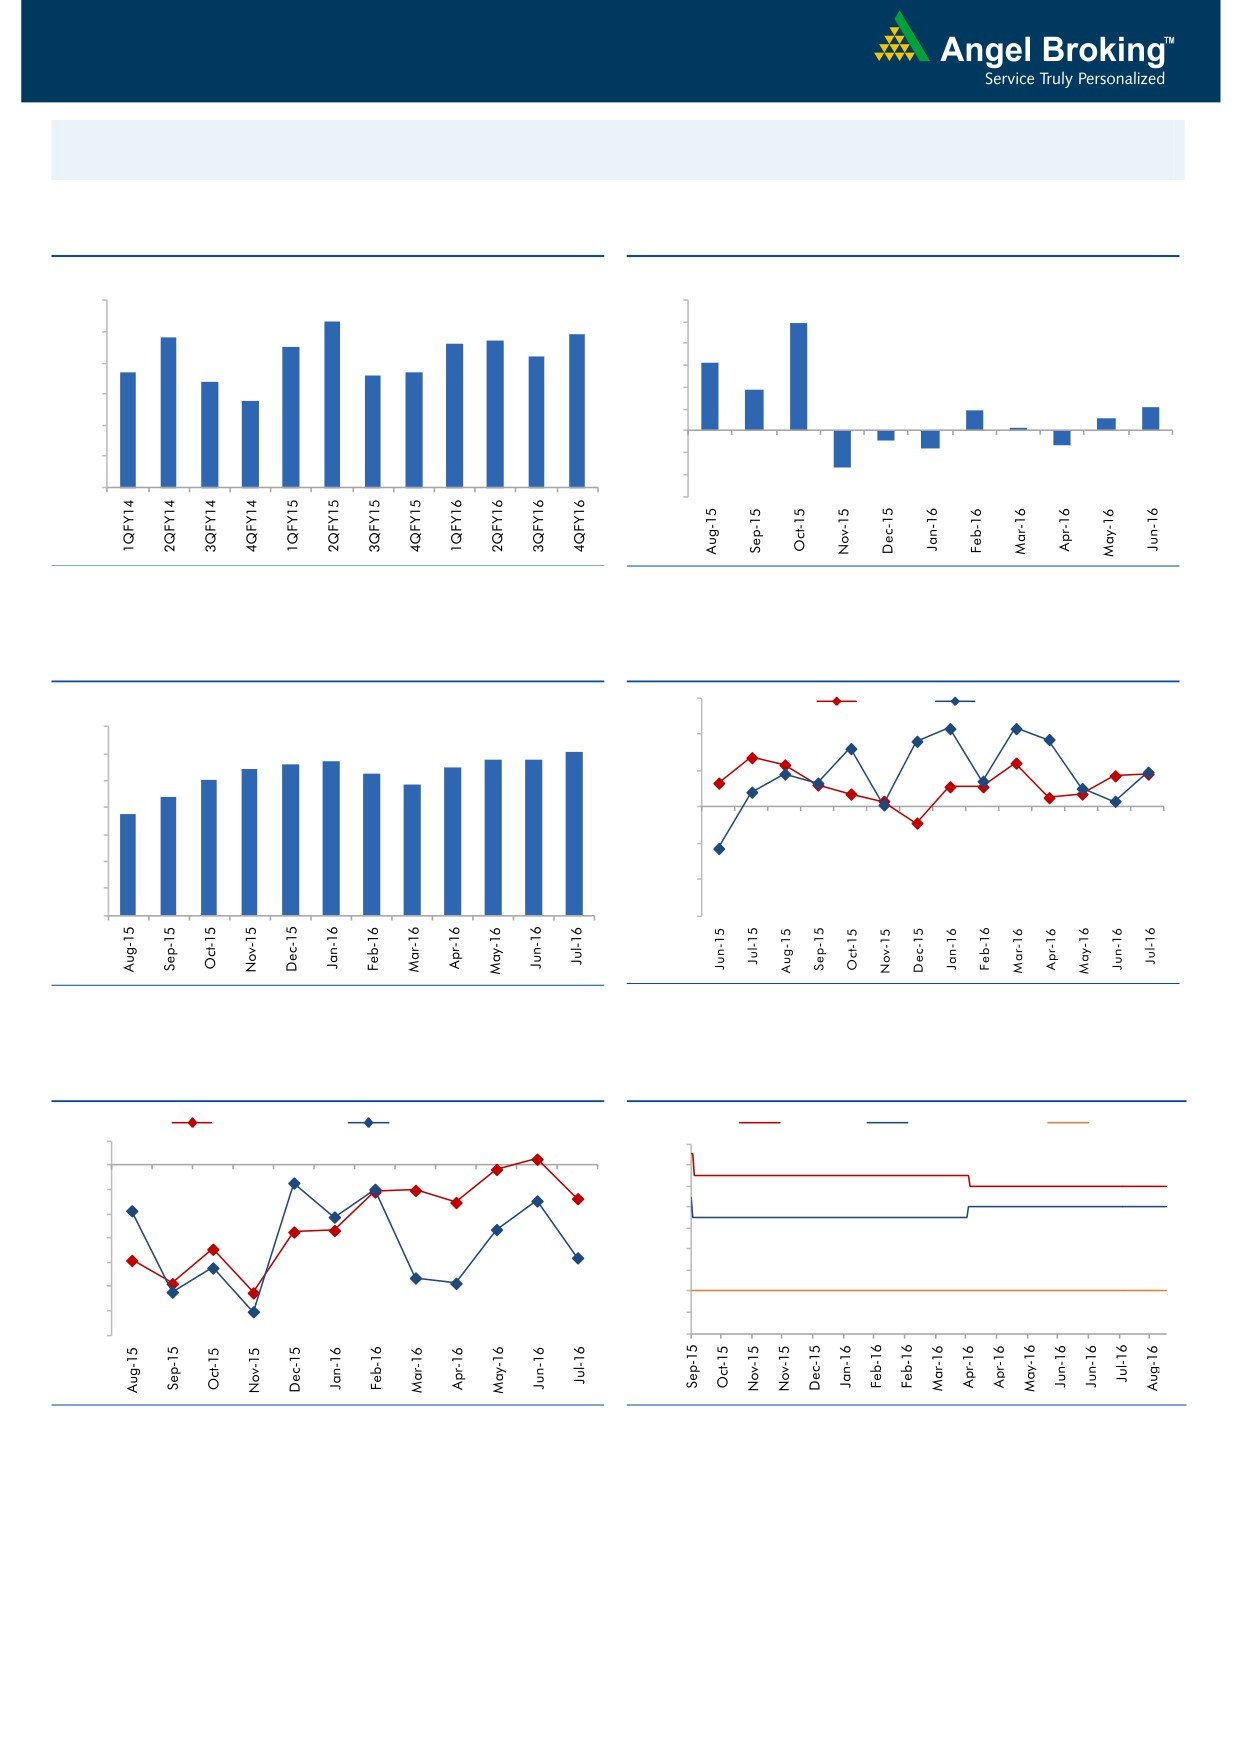
Macro watch
Exhibit 1: Quarterly GDP trends
Exhibit 2: IIP trends
(%)
(%)
9.0
8.3
12.0
9.9
7.8
7.7
7.9
10.0
8.0
7.5
7.6
7.2
8.0
6.3
6.7
6.6
6.7
7.0
6.4
6.0
3.7
5.8
4.0
2.1
6.0
1.9
1.1
2.0
0.3
5.0
-
4.0
(2.0)
(0.9)
(1.3)
(1.6)
(4.0)
3.0
(3.4)
(6.0)
Source: CSO, Angel Research
Source: MOSPI, Angel Research
Exhibit 3: Monthly CPI inflation trends
Exhibit 4: Manufacturing and services PMI
56.0
Mfg. PMI
Services PMI
(%)
7.0
6.1
54.0
5.6
5.7
5.8
5.8
5.4
5.5
6.0
5.3
5.0
4.8
52.0
5.0
4.4
3.7
4.0
50.0
3.0
48.0
2.0
46.0
1.0
-
44.0
Source: MOSPI, Angel Research
Source: Market, Angel Research; Note: Level above 50 indicates expansion
Exhibit 5: Exports and imports growth trends
Exhibit 6: Key policy rates
(%)
Exports yoy growth
Imports yoy growth
(%)
Repo rate
Reverse Repo rate
CRR
5.0
7.50
0.0
7.00
(5.0)
6.50
6.00
(10.0)
5.50
(15.0)
5.00
(20.0)
4.50
(25.0)
4.00
(30.0)
3.50
(35.0)
3.00
Source: Bloomberg, Angel Research
Source: RBI, Angel Research
Market Outlook
August 26, 2016
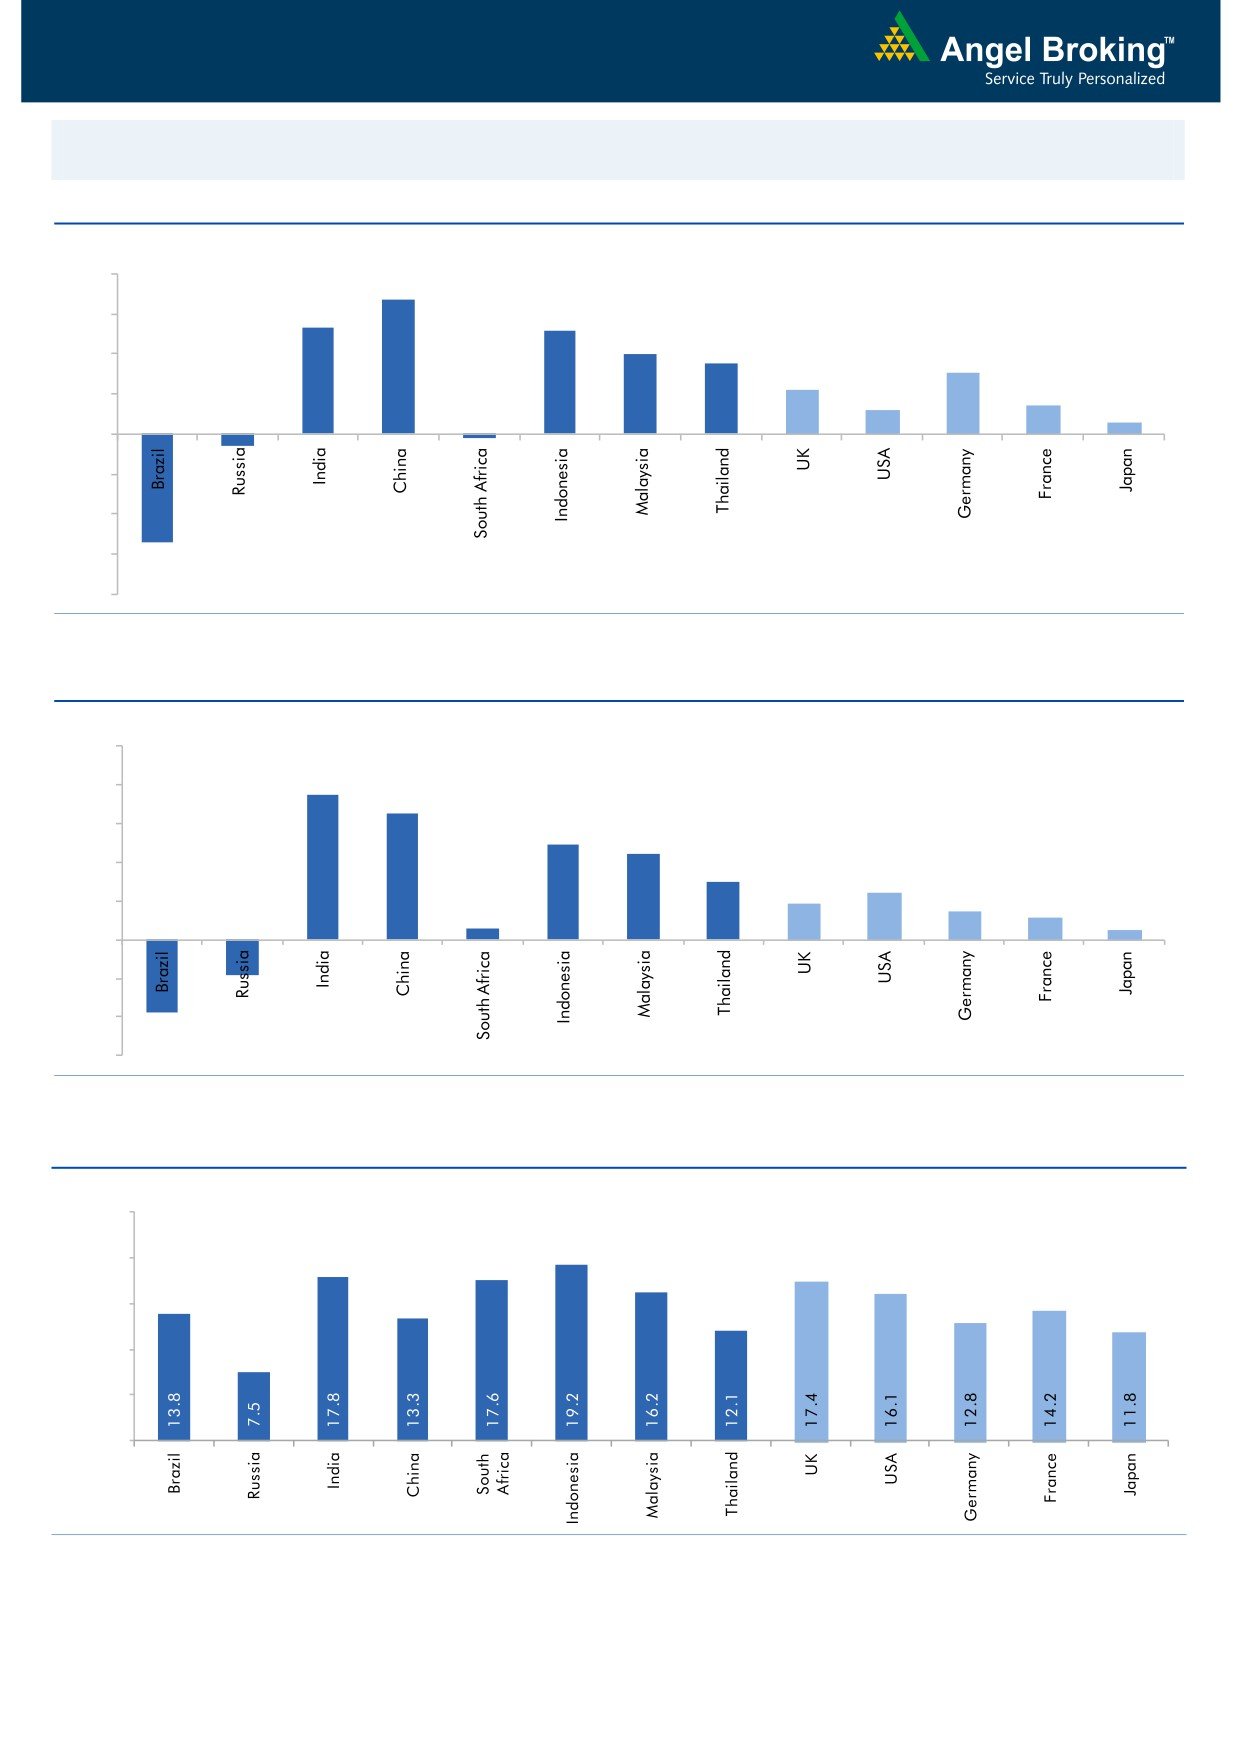
Global watch
Exhibit 1: Latest quarterly GDP Growth (%, yoy) across select developing and developed countries
(%)
8.0
6.7
6.0
5.3
5.2
4.0
3.5
4.0
3.1
2.2
2.0
1.2
1.4
0.6
-
(2.0)
(0.6)
(4.0)
(6.0)
(5.4)
(0.2)
(8.0)
Source: Bloomberg, Angel Research
Exhibit 2: 2016 GDP Growth projection by IMF (%, yoy) across select developing and developed countries
(%)
10.0
7.5
8.0
6.5
6.0
4.9
4.4
4.0
3.0
2.4
1.9
1.5
2.0
1.1
0.6
0.5
(3.8)
(1.8)
-
(2.0)
(4.0)
(6.0)
Source: IMF, Angel Research
Exhibit 3: One year forward P-E ratio across select developing and developed countries
(x)
25.0
20.0
15.0
10.0
5.0
-
Source: IMF, Angel Research
Market Outlook
August 26, 2016
Exhibit 4: Relative performance of indices across globe
Returns (%)
Country
Name of index
Closing price
1M
3M
1YR
Brazil
Bovespa
57,722
1.7
17.7
23.7
Russia
Micex
1,986
2.4
3.7
19.7
India
Nifty
8,592
(0.5)
8.3
1.5
China
Shanghai Composite
3,068
2.6
8.8
(18.1)
South Africa
Top 40
46,760
1.0
(0.6)
10.9
Mexico
Mexbol
47,734
1.7
3.5
9.9
Indonesia
LQ45
941
4.6
17.4
21.4
Malaysia
KLCI
1,680
1.1
3.3
6.4
Thailand
SET 50
984
2.5
11.5
6.4
USA
Dow Jones
18,448
(0.1)
3.3
10.8
UK
FTSE
6,817
1.4
8.8
9.1
Japan
Nikkei
16,556
(0.4)
(1.2)
(19.3)
Germany
DAX
10,530
2.8
2.4
2.6
France
CAC
4,407
0.3
(2.4)
(5.3)
Source: Bloomberg, Angel Research
Stock Watch
August 26, 2016
Company Name
Reco
CMP
Target
Mkt Cap
Sales ( Čcr )
OPM(%)
EPS (Č)
PER(x)
P/BV(x)
RoE(%)
EV/Sales(x)
(Č)
Price ( Č)
( Č cr )
FY17E FY18E
FY17E
FY18E
FY17E
FY18E
FY17E
FY18E
FY17E
FY18E
FY17E
FY18E
FY17E
FY18E
Agri / Agri Chemical
Rallis
Neutral
228
-
4,441
1,937
2,164
13.3
14.3
9.0
11.0
25.4
20.8
4.4
3.9
18.4
19.8
2.3
2.1
United Phosphorus
Accumulate
633
684
27,111
15,176
17,604
18.5
18.5
37.4
44.6
16.9
14.2
3.3
2.8
21.4
21.2
1.9
1.6
Auto & Auto Ancillary
Ashok Leyland
Buy
87
111
24,645
22,407
26,022
10.6
10.6
5.2
6.4
16.6
13.5
3.8
3.2
23.6
24.7
1.2
1.0
Bajaj Auto
Neutral
2,863
-
82,846
25,093
27,891
19.5
19.2
143.9
162.5
19.9
17.6
5.6
4.8
30.3
29.4
3.0
2.7
Bharat Forge
Neutral
853
-
19,846
7,726
8,713
20.5
21.2
35.3
42.7
24.2
20.0
4.5
4.0
18.9
20.1
2.6
2.3
Eicher Motors
Neutral
22,091
-
60,001
16,583
20,447
17.5
18.0
598.0
745.2
36.9
29.6
12.6
9.6
41.2
38.3
3.5
2.7
Gabriel India
Neutral
120
-
1,723
1,544
1,715
9.0
9.3
5.4
6.3
22.2
19.0
4.2
3.7
18.9
19.5
1.1
0.9
Hero Motocorp
Neutral
3,304
-
65,972
31,253
35,198
15.3
15.0
172.3
192.1
19.2
17.2
7.0
6.0
38.9
37.0
2.0
1.7
Jamna Auto Industries Neutral
220
-
1,755
1,486
1,620
9.8
9.9
15.0
17.2
14.6
12.8
3.2
2.7
21.8
21.3
1.3
1.1
L G Balakrishnan & Bros Neutral
457
-
717
1,302
1,432
11.6
11.9
43.7
53.0
10.5
8.6
1.5
1.3
13.8
14.2
0.6
0.6
Mahindra and Mahindra Neutral
1,414
-
87,844
46,534
53,077
11.6
11.7
67.3
78.1
21.0
18.1
3.4
3.0
15.4
15.8
1.9
1.6
Maruti
Neutral
4,935
-
149,063
69,186
82,217
14.7
14.4
198.5
241.4
24.9
20.4
4.8
3.9
20.2
20.0
1.9
1.5
Minda Industries
Neutral
1,269
-
2,013
2,728
3,042
9.0
9.1
68.2
86.2
18.6
14.7
4.2
3.4
23.8
24.3
0.8
0.7
Motherson Sumi
Neutral
324
-
42,830
45,896
53,687
7.8
8.3
13.0
16.1
24.8
20.1
8.0
6.4
34.7
35.4
1.0
0.8
Rane Brake Lining
Neutral
670
-
530
511
562
11.3
11.5
28.1
30.9
23.8
21.7
3.6
3.3
15.3
15.0
1.2
1.1
Setco Automotive
Neutral
46
-
612
741
837
13.0
13.0
15.2
17.0
3.0
2.7
0.5
0.5
15.8
16.3
1.2
1.1
Tata Motors
Neutral
494
-
142,556
300,209
338,549
8.9
8.4
42.7
54.3
11.6
9.1
1.9
1.6
15.6
17.2
0.6
0.5
TVS Motor
Accumulate
307
330
14,561
13,390
15,948
6.9
7.1
12.8
16.5
24.0
18.5
6.0
4.7
26.3
27.2
1.1
0.9
Amara Raja Batteries
Buy
883
1,076
15,078
5,717
6,733
18.7
18.9
38.4
48.9
23.0
18.1
5.7
4.7
25.3
24.8
2.5
2.1
Exide Industries
Neutral
177
-
15,024
7,439
8,307
15.0
15.0
8.1
9.3
21.8
19.0
3.1
2.7
14.3
16.7
1.6
1.4
Apollo Tyres
Accumulate
174
183
8,849
12,877
14,504
14.3
13.9
21.4
23.0
8.1
7.6
1.3
1.1
16.4
15.2
0.9
0.8
Ceat
Buy
862
1,119
3,487
7,524
8,624
13.0
12.7
131.1
144.3
6.6
6.0
1.2
1.0
19.8
18.6
0.5
0.5
JK Tyres
Neutral
126
-
2,859
7,455
8,056
15.0
15.0
21.8
24.5
5.8
5.1
1.2
1.0
22.8
21.3
0.5
0.4
Swaraj Engines
Neutral
1,126
-
1,398
660
810
15.2
16.4
54.5
72.8
20.7
15.5
6.4
5.8
31.5
39.2
2.0
1.6
Subros
Neutral
102
-
612
1,488
1,681
11.7
11.9
6.4
7.2
15.9
14.2
1.7
1.5
10.8
11.4
0.6
0.5
Indag Rubber
Neutral
172
-
452
286
326
19.8
16.8
11.7
13.3
14.7
12.9
2.5
2.3
17.8
17.1
1.3
1.1
Capital Goods
ACE
Neutral
43
-
426
709
814
4.1
4.6
1.4
2.1
30.8
20.5
1.3
1.2
4.4
6.0
0.8
0.7
BEML
Accumulate
1,036
1,157
4,313
3,451
4,055
6.3
9.2
31.4
57.9
33.0
17.9
2.0
1.8
6.3
10.9
1.4
1.2
Bharat Electronics
Buy
1,206
1,414
28,939
8,137
9,169
16.8
17.2
58.7
62.5
20.5
19.3
3.2
2.8
44.6
46.3
2.6
2.3
Stock Watch
August 26, 2016
Company Name
Reco
CMP
Target
Mkt Cap
Sales ( Čcr )
OPM(%)
EPS (Č)
PER(x)
P/BV(x)
RoE(%)
EV/Sales(x)
(Č)
Price ( Č)
( Č cr )
FY17E
FY18E
FY17E
FY18E
FY17E
FY18E
FY17E
FY18E
FY17E
FY18E
FY17E
FY18E
FY17E
FY18E
Capital Goods
Voltas
Accumulate
380
407
12,559
6,511
7,514
7.9
8.7
12.9
16.3
29.4
23.3
5.3
4.6
16.7
18.5
1.7
1.5
BGR Energy
Neutral
115
-
830
16,567
33,848
6.0
5.6
7.8
5.9
14.7
19.5
0.8
0.8
4.7
4.2
0.2
0.1
BHEL
Neutral
141
-
34,474
28,797
34,742
-
2.8
2.3
6.9
61.2
20.4
1.0
1.0
1.3
4.8
0.8
0.6
Blue Star
Accumulate
490
527
4,672
4,351
5,024
6.4
7.1
17.2
20.6
28.5
23.7
18.6
15.5
23.1
24.1
1.1
1.0
Crompton Greaves
Neutral
84
-
5,274
5,777
6,120
5.9
7.0
3.3
4.5
25.5
18.7
1.1
1.1
4.4
5.9
0.9
0.8
Greaves Cotton
Neutral
136
-
3,329
1,755
1,881
16.8
16.9
7.8
8.5
17.5
16.0
3.5
3.3
20.6
20.9
1.6
1.4
Inox Wind
Buy
189
286
4,189
5,605
6,267
15.7
16.4
24.8
30.0
7.6
6.3
2.1
1.6
25.9
24.4
0.8
0.7
KEC International
Neutral
137
-
3,531
9,294
10,186
7.9
8.1
9.9
11.9
13.9
11.5
2.0
1.8
15.6
16.3
0.6
0.6
Thermax
Neutral
841
-
10,017
5,421
5,940
7.3
7.3
25.7
30.2
32.7
27.8
4.0
3.6
12.2
13.1
1.7
1.6
VATech Wabag
Buy
573
681
3,124
3,136
3,845
8.9
9.1
26.0
35.9
22.0
16.0
2.8
2.4
13.4
15.9
0.9
0.7
Cement
ACC
Neutral
1,647
-
30,921
11,225
13,172
13.2
16.9
44.5
75.5
37.0
21.8
3.5
3.2
11.2
14.2
2.8
2.4
Ambuja Cements
Neutral
265
-
52,600
9,350
10,979
18.2
22.5
5.8
9.5
45.7
27.9
3.8
3.4
10.2
12.5
5.7
4.8
India Cements
Neutral
144
-
4,411
4,364
4,997
18.5
19.2
7.9
11.3
18.2
12.7
1.3
1.3
8.0
8.5
1.8
1.6
JK Cement
Neutral
780
-
5,452
4,398
5,173
15.5
17.5
31.2
55.5
25.0
14.1
3.0
2.6
12.0
15.5
1.8
1.5
J K Lakshmi Cement
Neutral
450
-
5,293
2,913
3,412
14.5
19.5
7.5
22.5
60.0
20.0
3.7
3.1
12.5
18.0
2.4
2.0
Orient Cement
Neutral
185
-
3,785
2,114
2,558
18.5
20.5
8.1
11.3
22.8
16.4
3.4
2.8
9.0
14.0
2.3
1.8
UltraTech Cement
Neutral
3,792
-
104,068
25,768
30,385
21.0
23.5
111.0
160.0
34.2
23.7
4.4
3.8
13.5
15.8
4.2
3.5
Construction
ITNL
Buy
72
93
2,352
8,946
10,017
31.0
31.6
8.1
9.1
8.8
7.9
0.3
0.3
4.2
5.0
3.6
3.3
KNR Constructions
Neutral
707
-
1,988
1,210
1,595
15.4
16.0
33.9
52.1
20.9
13.6
3.2
2.8
13.6
18.0
1.7
1.2
Larsen & Toubro
Buy
1,457
1,700
135,826
67,665
77,249
10.7
11.5
57.3
71.2
25.4
20.5
2.3
2.2
12.6
14.3
2.2
1.9
Gujarat Pipavav Port
Neutral
171
-
8,286
705
788
52.2
51.7
5.0
5.6
34.3
30.6
3.4
3.0
11.2
11.2
11.4
9.8
MBL Infrastructures
Buy
116
285
479
2,797
3,405
14.7
15.4
21.0
34.8
5.5
3.3
0.6
0.5
11.0
16.2
0.8
0.8
Nagarjuna Const.
Neutral
84
-
4,667
8,842
9,775
9.1
8.8
5.3
6.4
15.8
13.1
1.3
1.2
8.2
9.1
0.7
0.6
PNC Infratech
Accumulate
122
129
3,127
2,350
2,904
13.4
13.7
48.0
42.0
2.5
2.9
0.5
0.4
16.8
13.2
1.4
1.2
Simplex Infra
Neutral
298
-
1,474
6,829
7,954
10.5
10.5
31.4
37.4
9.5
8.0
1.0
0.9
9.9
13.4
0.6
0.5
Power Mech Projects
Neutral
475
-
699
1,801
2,219
12.7
14.6
72.1
113.9
6.6
4.2
1.2
1.0
16.8
11.9
0.4
0.3
Sadbhav Engineering
Accumulate
286
298
4,902
3,598
4,140
10.3
10.6
9.0
11.9
31.8
24.0
3.3
2.9
9.9
11.9
1.6
1.4
NBCC
Neutral
240
-
14,409
7,428
9,549
7.9
8.6
8.2
11.0
29.3
21.8
1.5
1.2
28.2
28.7
1.7
1.2
MEP Infra
Neutral
43
-
695
1,877
1,943
30.6
29.8
3.0
4.2
14.3
10.2
6.9
4.7
0.6
0.6
1.8
1.6
Stock Watch
August 26, 2016
Company Name
Reco
CMP
Target
Mkt Cap
Sales ( Čcr )
OPM(%)
EPS (Č)
PER(x)
P/BV(x)
RoE(%)
EV/Sales(x)
(Č)
Price ( Č)
( Č cr )
FY17E
FY18E
FY17E
FY18E
FY17E
FY18E
FY17E
FY18E
FY17E
FY18E
FY17E
FY18E
FY17E
FY18E
Construction
SIPL
Neutral
98
-
3,439
1,036
1,252
65.5
66.2
(8.4)
(5.6)
3.7
4.2
(22.8)
(15.9)
11.5
9.6
Engineers India
Neutral
260
-
8,769
1,725
1,935
16.0
19.1
11.4
13.9
22.8
18.7
3.2
3.1
13.4
15.3
3.8
3.4
Financials
Axis Bank
Neutral
586
-
139,959
58,081
66,459
3.5
3.5
32.4
44.6
18.1
13.1
2.4
2.1
13.6
16.5
-
-
Bank of Baroda
Neutral
162
-
37,281
19,980
23,178
1.8
1.8
11.5
17.3
14.1
9.4
1.6
1.3
8.3
10.1
-
-
Canara Bank
Neutral
270
-
14,680
15,225
16,836
1.8
1.8
14.5
28.0
18.6
9.7
1.3
1.0
5.8
8.5
-
-
Dewan Housing Finance Neutral
281
-
8,189
2,225
2,688
2.9
2.9
29.7
34.6
9.5
8.1
1.5
1.3
16.1
16.8
-
-
Equitas Holdings
Buy
181
235
6,077
939
1,281
11.7
11.5
5.8
8.2
31.2
22.1
2.7
2.4
10.9
11.5
-
-
Federal Bank
Neutral
67
-
11,503
9,353
10,623
2.9
2.9
4.4
5.8
15.2
11.5
1.5
1.3
9.5
11.0
-
-
HDFC
Neutral
1,358
-
214,632
11,475
13,450
3.4
3.4
45.3
52.5
30.0
25.9
5.8
5.1
20.2
20.5
-
-
HDFC Bank
Accumulate
1,258
1,350
318,417
46,097
55,433
4.5
4.5
58.4
68.0
21.5
18.5
3.8
3.2
18.8
18.6
-
-
ICICI Bank
Neutral
247
-
143,765
39,029
45,903
3.3
3.3
16.7
16.3
14.8
15.2
1.8
1.7
10.1
12.4
-
-
LIC Housing Finance
Neutral
558
-
28,137
3,712
4,293
2.6
2.5
39.0
46.0
14.3
12.1
2.7
2.3
19.9
20.1
-
-
Punjab Natl.Bank
Neutral
126
-
24,692
23,532
23,595
2.3
2.4
6.8
12.6
18.5
10.0
2.9
2.0
3.3
6.5
-
-
South Ind.Bank
Neutral
22
-
3,011
6,435
7,578
2.5
2.5
2.7
3.1
8.3
7.2
1.1
0.9
10.1
11.2
-
-
St Bk of India
Neutral
250
-
194,108
88,650
98,335
2.6
2.6
13.5
18.8
18.5
13.3
1.8
1.5
7.0
8.5
-
-
Union Bank
Neutral
134
-
9,225
13,450
14,925
2.3
2.3
25.5
34.5
5.3
3.9
0.8
0.7
7.5
10.2
-
-
Yes Bank
Neutral
1,344
-
56,567
8,978
11,281
3.3
3.4
74.0
90.0
18.2
14.9
3.5
2.9
17.0
17.2
-
-
FMCG
Asian Paints
Neutral
1,107
-
106,212
17,128
18,978
16.8
16.4
19.1
20.7
58.0
53.5
20.2
19.0
34.8
35.5
6.2
5.6
Britannia
Neutral
3,460
-
41,516
9,795
11,040
14.6
14.9
80.3
94.0
43.1
36.8
17.7
13.7
41.2
-
4.1
3.6
Colgate
Neutral
947
-
25,760
4,605
5,149
23.4
23.4
23.8
26.9
39.8
35.2
22.0
17.2
64.8
66.8
5.5
4.9
Dabur India
Neutral
292
-
51,428
8,315
9,405
19.8
20.7
8.1
9.2
36.1
31.8
10.1
8.3
31.6
31.0
5.9
5.2
GlaxoSmith Con*
Neutral
6,268
-
26,361
4,350
4,823
21.2
21.4
179.2
196.5
35.0
31.9
9.3
7.9
27.1
26.8
5.4
4.8
Godrej Consumer
Neutral
1,530
-
52,112
10,235
11,428
18.4
18.6
41.1
44.2
37.2
34.6
8.3
7.0
24.9
24.8
5.2
4.6
HUL
Neutral
910
-
197,022
35,252
38,495
17.6
17.4
20.4
21.9
44.6
41.6
36.6
32.1
82.2
77.3
5.5
5.0
ITC
Accumulate
253
283
305,754
40,059
44,439
39.0
39.2
9.1
10.1
27.9
25.1
7.6
6.7
27.2
26.5
7.0
6.3
Marico
Neutral
286
-
36,847
6,430
7,349
18.8
19.5
6.4
7.7
44.6
37.1
13.5
11.3
33.2
32.5
5.7
4.9
Nestle*
Neutral
6,831
-
65,860
10,073
11,807
20.7
21.5
124.8
154.2
54.7
44.3
22.5
20.2
34.8
36.7
6.3
5.4
Tata Global
Neutral
140
-
8,864
8,675
9,088
9.8
9.8
7.4
8.2
19.0
17.1
2.2
2.1
7.9
8.1
0.9
0.9
Procter & Gamble
Accumulate
6,730
7,369
21,847
2,939
3,342
23.2
23.0
146.2
163.7
46.0
41.1
103.1
98.8
25.3
23.5
7.1
6.1
Hygiene
Stock Watch
August 26, 2016
Company Name
Reco
CMP
Target
Mkt Cap
Sales ( Čcr )
OPM(%)
EPS (Č)
PER(x)
P/BV(x)
RoE(%)
EV/Sales(x)
(Č)
Price ( Č)
( Č cr )
FY17E FY18E
FY17E
FY18E
FY17E
FY18E
FY17E
FY18E
FY17E
FY18E
FY17E
FY18E
FY17E
FY18E
IT
HCL Tech^
Buy
799
1,000
112,677
49,242
57,168
20.5
20.5
55.7
64.1
14.3
12.5
2.9
2.2
20.3
17.9
2.1
1.7
Infosys
Buy
1,037
1,370
238,090
69,934
79,025
27.5
27.5
64.8
72.0
16.0
14.4
3.5
3.2
22.0
22.3
2.9
2.5
TCS
Buy
2,550
3,004
502,479
121,684
136,286
27.3
27.3
135.0
150.1
18.9
17.0
6.3
5.8
33.2
33.9
3.9
3.5
Tech Mahindra
Buy
458
700
44,478
30,347
33,685
17.0
17.0
37.5
41.3
12.2
11.1
2.7
2.3
21.8
20.7
1.2
1.0
Wipro
Buy
505
680
124,796
51,631
55,822
21.7
17.9
35.9
36.9
14.1
13.7
2.9
2.7
19.0
18.1
2.2
2.0
Media
D B Corp
Neutral
409
-
7,522
2,297
2,590
27.4
28.2
21.0
23.4
19.5
17.5
4.6
3.9
23.7
23.1
3.1
2.6
HT Media
Neutral
79
-
1,831
2,693
2,991
12.6
12.9
7.9
9.0
10.0
8.7
0.9
0.8
7.8
8.3
0.3
0.1
Jagran Prakashan
Accumulate
189
205
6,169
2,355
2,635
28.0
28.0
9.9
10.8
19.1
17.5
3.8
3.3
21.7
21.7
2.6
2.3
Sun TV Network
Neutral
467
-
18,421
2,850
3,265
70.1
71.0
26.2
30.4
17.8
15.4
4.6
4.0
24.3
25.6
6.0
5.1
Hindustan Media
Neutral
277
-
2,034
1,016
1,138
24.3
25.2
27.3
30.1
10.2
9.2
1.9
1.7
16.2
15.8
1.3
1.1
Ventures
TV Today Network
Buy
299
363
1,783
637
743
27.5
27.5
18.4
21.4
16.3
14.0
2.8
2.4
17.4
17.2
2.4
2.0
Metals & Mining
Coal India
Neutral
332
-
209,672
84,638
94,297
21.4
22.3
24.5
27.1
13.6
12.3
5.6
5.4
42.6
46.0
2.0
1.8
Hind. Zinc
Neutral
224
-
94,774
14,252
18,465
55.9
48.3
15.8
21.5
14.2
10.4
2.3
2.0
17.0
20.7
6.8
5.2
Hindalco
Neutral
154
-
31,852
107,899
112,095
7.4
8.2
9.2
13.0
16.8
11.9
0.8
0.8
4.8
6.6
0.8
0.8
JSW Steel
Neutral
1,748
-
42,243
53,201
58,779
16.1
16.2
130.6
153.7
13.4
11.4
1.8
1.6
14.0
14.4
1.6
1.4
NMDC
Neutral
108
-
42,700
6,643
7,284
44.4
47.7
7.1
7.7
15.2
14.0
1.3
1.3
8.8
9.2
4.3
3.8
SAIL
Neutral
49
-
20,093
47,528
53,738
(0.7)
2.1
(1.9)
2.6
18.7
0.5
0.5
(1.6)
3.9
1.3
1.2
Vedanta
Neutral
170
-
50,370
71,744
81,944
19.2
21.7
13.4
20.1
12.7
8.5
1.1
1.0
8.4
11.3
1.1
0.8
Tata Steel
Neutral
372
-
36,168
121,374
121,856
7.2
8.4
18.6
34.3
20.0
10.9
1.3
1.1
6.1
10.1
0.9
0.9
Oil & Gas
Cairn India
Neutral
201
-
37,703
9,127
10,632
4.3
20.6
8.8
11.7
22.9
17.2
0.7
0.7
3.3
4.2
5.7
4.7
GAIL
Neutral
373
-
47,340
56,220
65,198
9.3
10.1
27.1
33.3
13.8
11.2
1.3
1.2
9.3
10.7
1.0
0.9
ONGC
Neutral
238
-
203,835
137,222
152,563
15.0
21.8
19.5
24.1
12.2
9.9
1.0
1.0
8.5
10.1
1.8
1.6
Indian Oil Corp
Neutral
570
-
138,418
373,359
428,656
5.9
5.5
54.0
59.3
10.6
9.6
1.6
1.5
16.0
15.6
0.5
0.4
Reliance Industries
Neutral
1,013
-
328,492
301,963
358,039
12.1
12.6
87.7
101.7
11.6
10.0
1.2
1.1
10.7
11.3
1.6
1.3
Pharmaceuticals
Alembic Pharma
Neutral
642
-
12,106
3,483
4,083
20.2
21.4
24.3
30.4
26.4
21.1
6.0
4.8
25.5
25.3
3.4
2.8
Aurobindo Pharma
Accumulate
789
877
46,185
15,720
18,078
23.7
23.7
41.4
47.3
19.1
16.7
5.0
3.9
29.6
26.1
3.2
2.7
Aventis*
Neutral
4,349
-
10,016
2,357
2,692
17.3
17.3
153.5
169.2
28.3
25.7
4.8
3.9
25.8
28.4
3.9
3.2
Cadila Healthcare
Accumulate
384
400
39,271
11,126
13,148
22.0
22.0
17.1
20.0
22.4
19.2
5.8
4.6
28.8
26.6
3.5
2.8
Cipla
Reduce
563
490
45,245
15,378
18,089
17.4
18.4
21.6
27.2
26.1
20.7
3.4
2.9
13.7
15.2
3.2
2.6
Stock Watch
August 26, 2016
Company Name
Reco
CMP
Target
Mkt Cap
Sales ( Čcr )
OPM(%)
EPS (Č)
PER(x)
P/BV(x)
RoE(%)
EV/Sales(x)
(Č)
Price ( Č)
( Č cr )
FY17E FY18E
FY17E
FY18E
FY17E
FY18E
FY17E
FY18E
FY17E
FY18E
FY17E
FY18E
FY17E
FY18E
Pharmaceuticals
Dr Reddy's
Neutral
3,050
-
52,007
16,043
18,119
23.1
24.7
126.0
157.8
24.2
19.3
3.6
3.1
15.7
17.1
3.2
2.8
Dishman Pharma
Sell
176
45
2,839
1,718
1,890
22.7
22.8
9.5
11.3
18.5
15.6
1.8
1.6
10.1
10.9
2.1
1.8
GSK Pharma*
Neutral
3,011
-
25,502
3,528
3,811
16.6
18.8
51.8
59.4
58.1
50.7
15.6
15.5
26.3
30.6
7.1
6.6
Indoco Remedies
Sell
319
225
2,941
1,112
1,289
18.2
18.2
13.2
15.6
24.2
20.5
4.3
3.6
19.2
19.2
2.7
2.4
Ipca labs
Accumulate
543
613
6,857
3,303
3,799
15.3
15.3
17.3
19.7
31.4
27.6
2.7
2.5
9.1
9.4
2.2
1.9
Lupin
Buy
1,523
1,809
68,645
15,912
18,644
26.4
26.7
58.1
69.3
26.2
22.0
5.1
4.2
21.4
20.9
4.4
3.6
Sun Pharma
Buy
765
944
184,076
31,129
35,258
30.0
30.9
28.0
32.8
27.3
23.3
4.2
3.5
18.7
18.9
5.5
4.7
Power
Tata Power
Neutral
76
-
20,461
36,916
39,557
17.4
27.1
5.1
6.3
14.8
12.0
1.3
1.2
9.0
10.3
1.6
1.4
NTPC
Neutral
159
-
130,856
86,605
95,545
17.5
20.8
11.8
13.4
13.5
11.8
1.4
1.3
10.5
11.1
2.9
2.9
Power Grid
Neutral
182
-
95,241
25,763
29,762
74.3
73.1
14.8
17.3
12.3
10.5
1.9
1.7
16.9
17.5
8.0
7.6
Real Estate
MLIFE
Buy
432
522
1,773
1,152
1,300
22.7
24.6
29.9
35.8
14.5
12.1
1.1
1.0
7.6
8.6
2.3
1.9
Telecom
Bharti Airtel
Neutral
346
-
138,370
105,086
114,808
34.5
34.7
12.2
16.4
28.4
21.1
1.9
1.8
6.8
8.4
2.3
2.0
Idea Cellular
Neutral
96
-
34,442
40,133
43,731
37.2
37.1
6.4
6.5
15.0
14.7
1.3
1.2
8.2
7.6
1.9
1.6
Others
Abbott India
Neutral
4,702
-
9,992
3,153
3,583
14.1
14.4
152.2
182.7
30.9
25.7
151.7
129.5
25.6
26.1
2.9
2.5
Bajaj Electricals
Accumulate
252
277
2,549
5,099
5,805
5.7
5.9
11.4
14.6
22.2
17.3
3.0
2.6
13.4
15.1
0.5
0.4
Finolex Cables
Neutral
429
-
6,564
2,883
3,115
12.0
12.1
14.2
18.6
30.2
23.1
16.1
14.1
15.8
14.6
2.0
1.8
Goodyear India*
Buy
546
631
1,260
1,598
1,704
10.4
10.2
49.4
52.6
11.1
10.4
51.1
44.8
18.2
17.0
0.5
61.8
Hitachi
Neutral
1,514
-
4,117
2,081
2,433
8.8
8.9
33.4
39.9
45.3
38.0
36.6
30.5
22.1
21.4
2.0
1.7
Jyothy Laboratories
Neutral
297
-
5,380
1,440
2,052
11.5
13.0
8.5
10.0
35.0
29.7
8.5
7.8
18.6
19.3
4.0
2.8
Page Industries
Neutral
14,271
-
15,917
2,450
3,124
20.1
17.6
299.0
310.0
47.7
46.0
317.8
242.6
47.1
87.5
6.5
5.2
Relaxo Footwears
Neutral
459
-
5,512
2,085
2,469
9.2
8.2
7.6
8.0
60.7
57.8
23.6
20.1
17.9
18.8
2.7
2.3
Siyaram Silk Mills
Accumulate
1,235
1,347
1,157
1,799
2,040
11.6
11.7
104.9
122.4
11.8
10.1
1.9
1.7
16.4
16.4
0.9
0.8
Styrolution ABS India*
Neutral
577
-
1,015
1,440
1,537
9.2
9.0
40.6
42.6
14.2
13.5
36.3
33.0
12.3
11.6
0.7
0.6
TVS Srichakra
Buy
2,528
2,932
1,936
2,304
2,614
13.7
13.8
231.1
266.6
10.9
9.5
284.1
223.7
33.9
29.3
0.8
0.7
HSIL
Neutral
364
-
2,631
2,384
2,515
15.8
16.3
15.3
19.4
23.8
18.8
23.6
20.3
7.8
9.3
1.3
1.2
Kirloskar Engines India
Neutral
279
-
4,040
2,554
2,800
9.9
10.0
10.5
12.1
26.6
23.1
11.1
10.5
10.7
11.7
1.2
1.1
Ltd
M M Forgings
Neutral
422
-
509
546
608
20.4
20.7
41.3
48.7
10.2
8.7
57.8
51.2
16.6
17.0
0.8
0.7
Banco Products (India)
Neutral
217
-
1,552
1,353
1,471
12.3
12.4
14.5
16.3
15.0
13.3
20.7
18.6
14.5
14.6
1.1
119.0
Competent Automobiles Neutral
186
-
114
1,137
1,256
3.1
2.7
28.0
23.6
6.6
7.9
35.8
32.3
14.3
11.5
0.1
0.1
Stock Watch
August 26, 2016
Company Name
Reco
CMP
Target
Mkt Cap
Sales ( Čcr )
OPM(%)
EPS (Č)
PER(x)
P/BV(x)
RoE(%)
EV/Sales(x)
(Č)
Price ( Č)
( Č cr )
FY17E
FY18E
FY17E
FY18E
FY17E
FY18E
FY17E
FY18E
FY17E
FY18E
FY17E
FY18E
FY17E
FY18E
Others
Nilkamal
Neutral
1,252
-
1,869
1,995
2,165
10.7
10.4
69.8
80.6
17.9
15.5
71.6
62.2
16.6
16.5
0.9
0.8
Visaka Industries
Neutral
164
-
260
1,051
1,138
10.3
10.4
21.0
23.1
7.8
7.1
21.0
19.6
9.0
9.2
0.5
0.5
Transport Corporation of
Neutral
368
-
2,818
2,671
2,911
8.5
8.8
13.9
15.7
26.6
23.5
3.6
3.2
13.7
13.8
1.1
1.1
India
Elecon Engineering
Accumulate
59
63
641
1,482
1,660
13.7
14.5
3.9
5.8
15.1
10.1
3.5
3.3
7.8
10.9
0.7
0.6
Surya Roshni
Accumulate
178
201
781
3,342
3,625
7.8
7.5
17.3
19.8
10.3
9.0
19.6
15.7
10.5
10.8
0.5
0.4
MT Educare
Neutral
145
-
578
366
417
17.7
18.2
9.4
10.8
15.5
13.4
3.4
3.0
22.2
22.3
1.5
1.3
Radico Khaitan
Buy
95
125
1,265
1,659
1,802
13.0
13.2
6.3
7.4
15.0
12.9
1.3
1.2
8.6
9.3
1.2
1.1
Garware Wall Ropes
Neutral
499
-
1,092
873
938
12.9
13.1
30.9
34.9
16.2
14.3
2.5
2.2
15.7
15.2
1.2
1.1
Wonderla Holidays
Neutral
405
-
2,289
287
355
38.0
40.0
11.3
14.2
35.9
28.5
5.1
4.5
21.4
23.9
7.8
6.3
Linc Pen & Plastics
Neutral
280
-
414
382
420
9.3
9.5
13.5
15.7
20.8
17.8
3.6
3.1
17.1
17.3
1.2
1.1
The Byke Hospitality
Neutral
160
-
641
287
384
20.5
20.5
7.6
10.7
21.0
14.9
4.4
3.6
20.7
23.5
2.3
1.7
Interglobe Aviation
Neutral
881
-
31,758
21,122
26,005
14.5
27.6
110.7
132.1
8.0
6.7
47.6
34.0
168.5
201.1
1.5
1.2
Coffee Day Enterprises
Neutral
254
-
5,230
2,964
3,260
20.5
21.2
4.7
8.0
-
31.7
2.9
2.7
5.5
8.5
2.2
1.9
Ltd
Navneet Education
Neutral
105
-
2,501
1,062
1,147
24.0
24.0
6.1
6.6
17.2
15.9
3.5
3.1
20.6
19.8
2.4
2.2
Navkar Corporation
Buy
197
265
2,803
408
612
42.9
42.3
6.8
11.5
29.0
17.1
2.0
1.8
6.9
10.5
7.8
5.2
UFO Moviez
Neutral
482
-
1,331
619
685
33.2
33.4
30.0
34.9
16.1
13.8
2.2
1.9
13.8
13.9
1.9
1.5
VRL Logistics
Neutral
297
-
2,708
1,902
2,119
16.7
16.6
14.6
16.8
20.4
17.6
4.5
3.9
21.9
22.2
1.6
1.4
Team Lease Serv.
Neutral
1,123
-
1,920
3,229
4,001
1.5
1.8
22.8
32.8
49.3
34.2
5.3
4.6
10.7
13.4
0.5
0.4
S H Kelkar & Co.
Neutral
296
-
4,284
1,036
1,160
15.1
15.0
6.1
7.2
48.5
41.3
5.2
4.8
10.7
11.5
4.0
3.5
Quick Heal
Neutral
237
-
1,657
408
495
27.3
27.0
7.7
8.8
30.6
26.9
2.8
2.8
9.3
10.6
3.3
2.7
Narayana Hrudaya
Neutral
314
-
6,422
1,873
2,166
11.5
11.7
2.6
4.0
118.8
79.3
7.3
6.6
6.1
8.3
3.6
3.1
Manpasand Bever.
Neutral
724
-
3,625
836
1,087
19.6
19.4
16.9
23.8
42.9
30.4
5.1
4.5
12.0
14.8
4.0
3.0
Parag Milk Foods
Neutral
313
-
2,634
1,919
2,231
9.3
9.6
9.5
12.9
33.2
24.2
5.2
4.3
15.5
17.5
1.5
1.3
Source: Company, Angel Research; Note: *December year end; #September year end; &October year end; Price as on August 25, 2016
Market Outlook
August 26, 2016
Research Team Tel: 022 - 39357800
DISCLAIMER
Angel Broking Private Limited (hereinafter referred to as “Angel”) is a registered Member of National Stock Exchange of India
Limited,Bombay Stock Exchange Limited and Metropolitan Stock Exchange Limited. It is also registered as a Depository Participant with
CDSL and Portfolio Manager with SEBI. It also has registration with AMFI as a Mutual Fund Distributor. Angel Broking Private Limited is a
registered entity with SEBI for Research Analyst in terms of SEBI (Research Analyst) Regulations, 2014 vide registration number
INH000000164. Angel or its associates has not been debarred/ suspended by SEBI or any other regulatory authority for accessing
/dealing in securities Market. Angel or its associates/analyst has not received any compensation / managed or
co-managed public offering of securities of the company covered by Analyst during the past twelve months.
This document is solely for the personal information of the recipient, and must not be singularly used as the basis of any investment
decision. Nothing in this document should be construed as investment or financial advice. Each recipient of this document should make
such investigations as they deem necessary to arrive at an independent evaluation of an investment in the securities of the companies
referred to in this document (including the merits and risks involved), and should consult their own advisors to determine the merits and
risks of such an investment.
Reports based on technical and derivative analysis center on studying charts of a stock's price movement, outstanding positions and
trading volume, as opposed to focusing on a company's fundamentals and, as such, may not match with a report on a company's
fundamentals. Investors are advised to refer the Fundamental and Technical Research Reports available on our website to evaluate the
contrary view, if any.
The information in this document has been printed on the basis of publicly available information, internal data and other reliable
sources believed to be true, but we do not represent that it is accurate or complete and it should not be relied on as such, as this
document is for general guidance only. Angel Broking Pvt. Limited or any of its affiliates/ group companies shall not be in any way
responsible for any loss or damage that may arise to any person from any inadvertent error in the information contained in this report.
Angel Broking Pvt. Limited has not independently verified all the information contained within this document. Accordingly, we cannot
testify, nor make any representation or warranty, express or implied, to the accuracy, contents or data contained within this document.
While Angel Broking Pvt. Limited endeavors to update on a reasonable basis the information discussed in this material, there may be
regulatory, compliance, or other reasons that prevent us from doing so.
This document is being supplied to you solely for your information, and its contents, information or data may not be reproduced,
redistributed or passed on, directly or indirectly.
Neither Angel Broking Pvt. Limited, nor its directors, employees or affiliates shall be liable for any loss or damage that may arise from
or in connection with the use of this information.